


The reliability of Census data on demography and migration comes under attack periodically. This article sheds light on the reliability of survey results with respect to migration into the Western Cape. Census data and two independent studies are compared and the convergence or divergence of the findings assessed. There is greater consistency for more aggregate-level measures than for disaggregated measures (whether by geographical unit or by race). Such comparisons of surveys are important for gauging the reliability of our knowledge of migration.
Introduction
As we speak, Statistics South Africa (StatsSA) is collecting data for the 2016 Community Survey. A nation-wide sample survey, it targets approximately 1.3 million households. The first phase should now be complete and will be followed by an evaluation phase ‘to verify the quality of the information collected’ (StatsSA, 2016). As was the case in the three post-democratic censuses and the 2007 Community Survey, the 2016 survey covers migration.
Knowing the size of a population and probable future growth is essential for the planning of service delivery and almost all government activities. The more accurate our data, the more confident we can be in predicting future population growth and thereby the magnitude of the need for services.
Compared with the other two basic demographic variables (fertility and mortality), migration is more difficult to measure. For example, whereas births and deaths are one-off events, migration can occur frequently or not at all. It is also difficult to define a migrant: for example, how does one decide whether someone fleeing unfavourable political conditions is a migrant or a refugee? In South Africa there are additional problems associated with the keeping of records on migration, since people are not required to register when they move from one province (or municipality) to another.
This article evaluates Census data by comparing it to data not produced by StatsSA (and vice versa). It aims to contribute to debates and discussions on data quality, with a focus on migration into the Western Cape.
Census data often under criticism
Criticisms of StatsSA’s surveys and data are not uncommon. In the case of demographic data, Rob Dorrington and Tom Moultrie have been fierce critics of StatsSA’s data. Dorrington notes that the 1996 Census’s Post Enumeration Survey ‘produced an estimate of the white population which was some 800 000 lower than projection from previous censuses’ (2001:37). He investigates whether the reason for the ‘missing whites’ is undeclared emigration. Noting the number of South African-born residents in the major receiving countries (USA; Canada; New Zealand; Australia and the UK), Dorrington concludes that ‘hidden migration accounts for only 250,000 of the missing whites and that 750,000 were probably not accounted for in the 1996 census’ (Dorrington 2001: 37). The 2011 Census again generated a controversy, this time due to ‘a sudden surge in fertility’ which ’directly contradicted numerous other surveys and models’ (Moultrie, quoted in De Wet 2012; Dorrington & Moultrie 2002).
Background: Census results on migration into the Western Cape
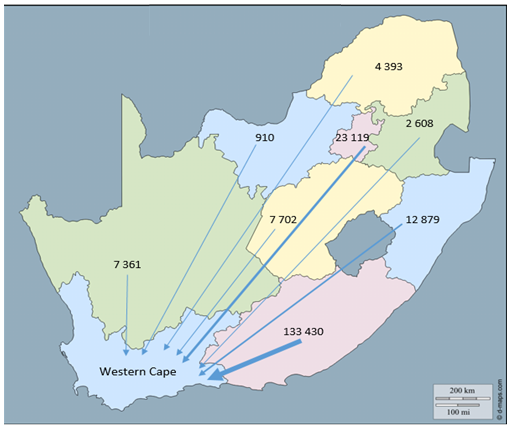
The results of the 2011 Census (StatsSA 2012a) show that, for the period 2001 to 2011, net inter-provincial migration for the Western Cape was 192 000 – the greatest contributor being the Eastern Cape (133 000), followed by Gauteng (23 000) and KZN (13 000). This amounts to an addition of 19 200 individuals per year between 2001 and 2011. These numbers and those in the map below only pertain to internal migration between the Western Cape and other provinces. Movements of people into the country (immigration) and out of the country (emigration) are not reflected.
Figure 1. Net migration to the Western Cape
from other provinces (Census 2011)
A second way to look at these flows is to consider a broader ‘net migration’ measure which includes immigrants (who are counted in the Census) but not emigrants (who are not counted in the Census, having left the country). While the broader ‘net migration’ figure is skewed due to the exclusion of emigrants, it still makes for an interesting comparison with the standard net-migration figure that captures only inter-provincial movement.
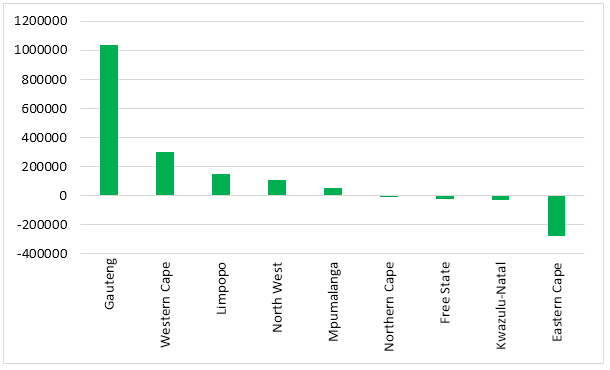
Figures 2 and 3 show the two measures for Census 2011 data. In terms of this broader net migration measure, ‘net migration’ of the Western Cape is 304 000 (as against 192 000 without immigrants), while Mpumalanga and Limpopo become net receivers rather than net losers of people when immigrants are included. The ranking of provinces in terms of ‘net migration’ also changes significantly: when immigrants are included, Limpopo moves from being a net sender to a net receiver of people and moves to third place – while Gauteng and the Western Cape keep their places at the top. The Eastern Cape is at the bottom of the broader of ranking for both measures.
Figure 2: Net inter-provincial migration (excluding immigrants) 2011
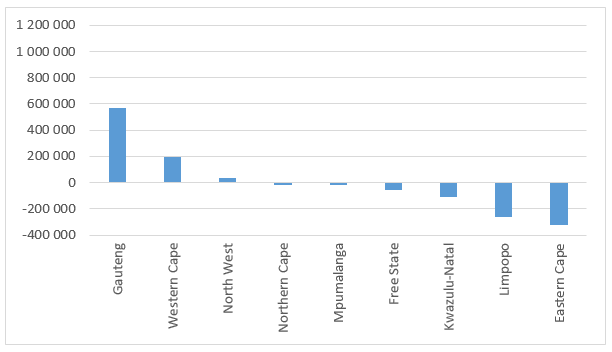
Figure 3: Net inter-provincial migration (including immigrants) 2011
Comparing Census results to other survey results
While the 2011 Census is the most recent of the censuses, I am not aware of any non-StatsSA surveys with which its results can be compared. Indeed, since social research is seldom conducted purely or mainly to verify findings, it is unusual to find two or more studies conducted on the same population at the same time. For these reasons I focus on two surveys conducted on the Western Cape at more or the less the same time as the 2001 Census.
- The first took place under the auspices of SALDRU at UCT in 2000 and focused on residents of Khayelitsha/Mitchell’s Plain (KMP). It allows a comparison with census data at the magisterial district level.
- The second was a study commissioned by the Provincial Government of the Western Cape (PGWC) and undertaken by researchers from the universities of Cape Town, Western Cape and Stellenbosch in 2001. It provides provincial-level data for the Western Cape.
In our assessment of the three surveys, we focus on results regarding place of birth and the time of migration to the Western Cape. The two relevant questions in Census 2001, which relate to establishing migration levels and patterns with respect to life-time migration, are: (1) Where were you born? (2) Were you living in this place five years ago?
- The KMP Survey asked: (1) What is the name of the place where you were born? If the respondent was born in a rural area: (2) In what year did you first move to a township or suburb? (SALDRU, 2000:9).
- The equivalent questions in the PGWC survey were: (1) Where was each member of the household born? (2) In what year did each member arrive at this dwelling? (WCPG, 2002:21)
Place of birth
The table below compares place-of-birth results at the provincial level, using the PGWC survey and the Census. Because of the sampling method used, whites were over-represented and coloureds under-represented in the PGWC survey when compared to the census data for 2001. Thus it was necessary to present the data by race and focus on proportions rather than absolute numbers. Table 1 shows the two sets of results and the difference between the two, for each race group.
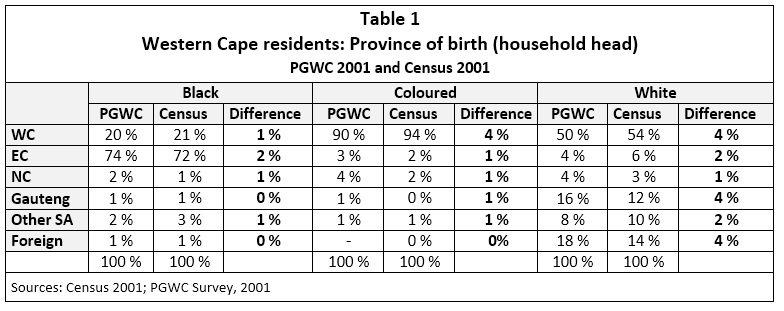
There are minimal differences between the two data sets for blacks and a maximum of 4% difference in the case of coloureds and whites. If 5% is taken as an acceptable margin of error, this comparison suggests an acceptable degree of consistency and, thereby, reliability of both the Census and the PGWC surveys. The KMP survey 2000 allows a similar analysis on managerial-district level, but unfortunately only for one such district. Table 2 compares place-of-birth data for the Mitchell’s Plain magisterial district from the KMP survey 2000 and Census 2001.
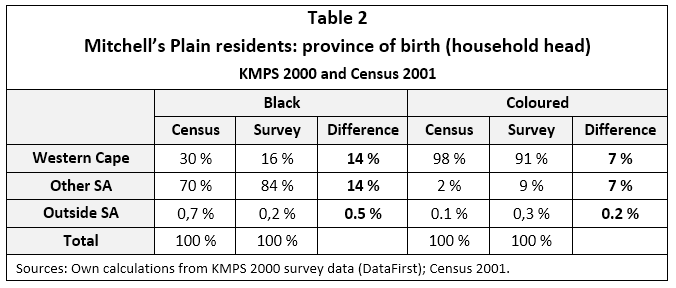
In this case, the criterion of a 5% margin of error is not satisfied. There is a 7% difference in the case of coloureds and a 14% difference in the case of blacks. A possible explanation for this degree of discrepancy is that the geographical base of the two studies was relatively small, or was different in important respects (see Ziehl 2016). On the other hand, the substantial difference for blacks may call into question the reliability of one, or both, of the two surveys at the magisterial district level – or for this district in particular.
Time of migration move
In the PGWC survey, the categories used for the timing of a respondent’s move to the Western Cape allow us to distinguish between those who moved before and after 1995 (PGWC, Main Report June 2002:21). In the Census, the relevant question allows for a distinction to be drawn between the people who moved to Cape Town before 1996 and those who moved afterwards. Although these categorizations are out of sync by one year, the analysis below (table 3) shows very few differences between the results of the two studies.
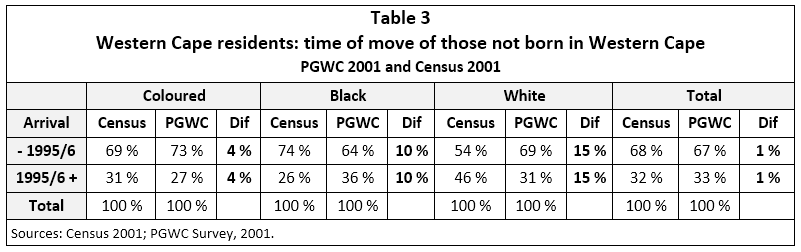
When the total population of the Western Cape is considered, more than two-thirds of respondents in both studies indicated that they had moved there before 1995/6. The difference between the results is only 1%. However, there are significant discrepancies in the results for blacks and whites – the 5% margin-of-error criterion is violated, as the difference between the two studies is 10% in the case of blacks and 15% in the case of whites.
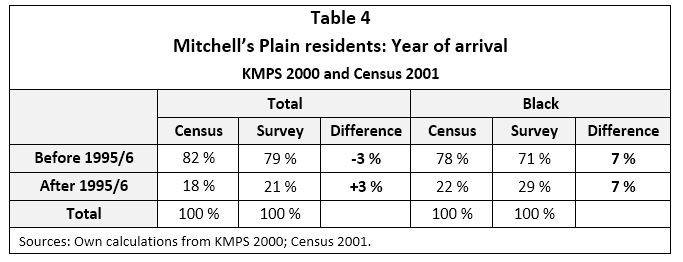
Table 4 repeats the exercise for the Mitchell’s Plain magisterial district (using the KMP survey). For the total population there is good consistency – a 3% difference between the Census and the KMP survey. In both cases, about 80% of the total population had moved into the area in 1996 or before. However, for black adults the 5% margin-of-error criterion is violated, with a 7% difference between the two surveys.
When considering the timing of moving to the area, it appears that there is some ambiguity regarding the consistency and reliability of the two surveys. For the total population there is considerable consistency. If the analysis is differentiated by race there is less consistency.
Conclusion
The comparisons presented above show mixed results with respect to the consistency of the findings and thereby their reliability. Of course, any discrepancy does not necessarily indicate that the Census is at fault – it could be either or both of the surveys being compared.
When place of birth is considered at the provincial level, there is consistency between the Census and the non-StatsSA survey (PGWC).
For place of birth at the magisterial-district level the findings diverge – particularly in the case of blacks. Whereas Census data show a third having been born in the Western Cape, the KMP survey shows that this applies to only 16%.
With respect to the timing of the move to the Western Cape, there is consistency for the total population at both the provincial and district level (Census, PGWC and KMP surveys).
However, on a race basis (for blacks and whites), the surveys diverge at the provincial level for the timing of the move. The Census shows 74% of blacks and 54% of whites arriving in or before 1996 whereas the PGWC-survey figure for blacks is 10% higher and that for whites 15% lower.
In general, these particular comparisons suggest that there is higher consistency for more aggregate-level measures than for disaggregate measures: provincial level is better than district level, and measuring by race is less reliable than measurements for the total population.
It seems clear, though, that we need regular comparative analyses, such as that presented above, to underpin our assessment of the reliability of migration data with respect to district, provincial or national level – whether sourced from StatsSA or from another survey institution. If no migration surveys are conducted this year by institutions other than StatsSA, the opportunity to compare data from the 2016 Community Survey with non-StatsSA data will have been missed.
Written by Susan Ziehl, Senior Research Associate, Institute for Social Development, University of Western Cape
EMAIL THIS ARTICLE SAVE THIS ARTICLE FEEDBACK
To subscribe email subscriptions@creamermedia.co.za or click here
To advertise email advertising@creamermedia.co.za or click here