5.1 Introduction
5.2 Some socio-economic indicators for South Africa
5.3 Service priorities for government
5.4 Budget Review 2000
5.5 Some service delivery achievements over the past five years
5.5.1 Environmental Affairs and Tourism
5.5.2 Health
5.5.3 Home Affairs
5.5.4 Correctional Services
5.5.5 Water Affairs
5.5.6 Welfare
5.5.7 Land Affairs and Agriculture
5.5.8 Arts, Culture, Science and Technology
5.5.9 Housing
5.5.10 Communications
5.5.11 Conclusion
5.6 Progress in terms of setting up systems during the past five years
5.7 What does the public think?
5.8 Remaining challenges to improve service delivery
On gaining power, the Government of National Unity inherited a society marked by deep social and economic inequalities, as well as serious racial, political and social divisions. In addition, the Constitution requires us to pursue a developmental agenda. The challenge for the government was far greater than simply delivering improved services as would have been the case in a normal society after a change in government.
The challenge was to formulate a whole new set of policies to give effect to the normative and value changes that went with the democratic transition. On the basis of these policies it had to extend service delivery to all its citizens – something unknown under the previous regime, while at the same time eradicating the inequities of the past which were a direct result of apartheid. Government had to undertake this exercise of redistributing and extending state services, and at the same time constructing a single nation from a deeply divided South Africa. At the same time it was faced by severe resource constraints, and watched eagle-eyed by that section of the population that since 1948 had been virtually the sole beneficiary of public goods. This part of the population controlled the media and had the capacity to create scandal and derive political gain out of the slightest mistake. They also controlled the economy and could do substantial damage to the international reputation of the new government.
The new democratic government inherited a situation where 40 per cent of the population was living below the poverty line. In the face of such desperate need, the undertaking of public sector transformation became a delicate balancing act. Tinkering with the racial composition of the public service, and changing ways of working may appear frivolous to some. However, transformation of the public service became the only lever that could dislodge the old way of doing things, the old choices of to whom to allocate resources, the old way of to whom to award common courtesy and to whom not. For South Africa the question is no longer: "Why change?" but rather ”how (and how fast and how much) can we change with greatest positive effect on service delivery?“
The purpose of this chapter is to capture the dilemma between the need for speedy service delivery to address extreme levels of poverty (while maintaining the country as a competitive, modern player in a global setting), and for transforming the public service, which is at the core of service delivery. To show the starkness of the dilemma, the chapter first presents some socio-economic statistics. It then reports on some services that have been, and are being, delivered. In the process of reporting on these services, we comment on the potential implications of delivering traditional government services through alternative means. The chapter ends by presenting some of the weaknesses still present in service delivery, concentrating on the experiences of selected provinces covered by the Integrated Implementation Plan (IIP) towards the end of 1999 as well as on some of the sectors currently covered under the DPSA review process.
In 1994 the African intellectual and political analyst Mandaza posed some perennial questions: ”How to rectify three centuries of colonial and racial domination without upsetting the very historical, political and economic bases upon which the Southern African sub-system has been built? How to address the problem of wages and improved conditions of living for the mass of the people while enduring that the rate of capitalist exploitation remains constant? In short, how to pursue the objectives of liberation. .. without falling victim to White males at home and abroad?” These issues are still prevalent today as demonstrated by the snapshots of our society as presented in Tables 5.1 and 5.2.
The above statistics, once again, demonstrate the stark realities of the daily lives of a large number of our citizens – no direct access to running water, extremely basic to inadequate arrangements for sanitation and no electricity for lighting purposes. This last indicator points to the fact that the electronic revolution, with its spin-offs in information technology is bypassing large components of our population. On a more mundane level, the absence of appropriate lighting also has a negative effect on establishing a culture of learning and reading, thus perpetuating the inequity in opportunity education. This results in us loosing the opportunity to wipe out inequality over time.
The sheer scope and immediacy of the needs for people are overwhelming, particularly if visualised against the resource pool in the country to meet these needs. A difficult balance has to be struck between meeting the bulk of the immediate needs and taking a medium- to longer-term perspective that may result in a better and more sustainable process. Public servants are not only responsible for product. They are also accountable for process. The mandatory requirements for some of these processes, e.g. inclusivity, equity and empowerment are contained in the Constitution and the RDP document. Apart from having to meet certain process requirements, the public service also has to deliver services on a massive scale. This in itself adds to the complexity of the delivery processes.
What does help, is that, over a considerable period of time now, the population has consistently identified priority areas in which they would like to see government concentrating its resources and efforts. Surprisingly these priority areas are not direct services to individual households to improve living conditions. The top priorities, job creation and a secure and crime free environment, rather point to the broader issue of creating a context within which households can provide better for themselves.
Government priorities over the past few years, i.e. job creation, a safe environment, meeting of basic needs, in a context of GEAR and the RDP, have proved to match the identified needs of the population at large. Surveys conducted since 1994 by Idasa and Opinion '991 have regularly tested public opinion on the following question: "What are the most important problems facing this country that government ought to address?" Table 5.3 on the following page captures the changing priorities since September 1994.
The Opinion '99 survey conducted from 6 April to 30 April 1999, revealed the following:
These surveys of opinions largely reflect what has already captured public concerns. On the margins are other key issues, the implications of which are just beginning to be fully appreciated by the majority of the populace. These include the scourge of HIV / Aids.
If the survey above constitutes the pattern of priorities of the residents of the country, then government’s response to these, in terms of the pattern of allocation of financial resources, is as follows:
Through the budget2, government is showing that it is responding to the need to address crime and other problems in the criminal justice sector. The Criminal Justice Sector, Justice, Police and Correctional Services, shows the strongest growth in the size of the budget allocation from 1996/7 to 1999/00 of all the services sectors. Although not quite on the same trajectory, significant growth for the Criminal Justice Sector is projected to continue over the next three years.
The largest components of expenditure in the budget has been and remains social services, which are so critical to human development and equity. The attempt to shift the pattern of expenditure from recurrent to capital is precisely to enable greater investment in services and infrastructure that promote human development and quality of life.
This is simply one example to show that the pattern of public expenditure has been led by policy priorities throughout, and the policy thrust has been to meet the basic needs.
Transformation in the public service is about maximising the impact of the state on society. In this way service delivery and related issues become useful indicators of whether the transformation process is succeeding or not. To provide an appropriate context for assessing the performance of the public service in delivering public goods and services, it is necessary to compliment financial indicators by equally focussing on output, quality, access, appropriateness, equity, sustainability and impact. If we have to draw up a report card in terms of progress with public sector transformation we can therefore pose the following questions:
The slow grinding away at backlogs, the time-consuming developing of new solutions, and the putting into place of adequate systems to support these new solutions are often forgotten when we read in media headlines of an individual whose gender got confused in the Home Affairs registration system, or when another prisoner escapes from prison. Traumatic as the effects may be on the individuals concerned, these types of incidents may not be the norm, but rather the exception.
Below is a set of examples of what the public service has actually delivered. By and large, the facts presented demonstrate the extension of services to new categories of users previously excluded and/ or the scaling up of the numbers of users. Departments have also started looking strategically at alternative ways in which services can be provided.
5.5.1 Environmental Affairs and Tourism
A 15 per cent increase in foreign tourists was set as a target for the end of the last century. By 1998, one year before the end of the forecasting period, this target had been achieved, contributing over R20 billion to the economy. The department has entered into an aggressive marketing effort that commands resources from both the private and public sectors to market South Africa as a top international tourist destination.
The department has also ensured South Africa’s role as a recognised player in the global environmental promotion effort. This will be crucial to the promotion of sustainable development in the country.
5.5.2 Health
- Between 1994 and 1999, the primary health care infrastructure was expanded by building 700 new clinics, upgrading 2298 clinics, building 124 new visiting points and purchasing 125 mobile clinics.
- More than five million South Africans have benefited from the Clinic Upgrading and Building programme and an average of 125 000 more patients per week are now making use of these essential services.
- Free health care was introduced for pregnant and lactating women and for children under the age of six years, as well as those who use the public primary health care system.
- Primary school nutrition services are provided to five million children.
- To improve access to specialist care and reduce patient travel times tele-medicine has been developed. Phase one of a three-year programme is due to start shortly in 28 pilot sites.
- The occurrence of measles has virtually been wiped out through a systematic immunisation programme that now covers close to a 100 per cent of the population.
5.5.3 Home Affairs
A significant proportion of the population annually relies on the services of the Department of Home Affairs. This department has a disproportionate influence on the perception that the citizens hold of the public service and government. To the extent that it is covered in the media, the department tends to be cast in a negative light. The rapid increase in the scope and coverage of some of the services the department delivers, if it were more widely understood, may elicit a more objective interpretation of the performance of this department. The summary of some of the services delivered by Home Affairs presented in Table 5.4 clearly shows a rapid increase in terms of the demands made on the department for services since 19943. They have managed to respond w without reducing service levels, notwithstanding vacancies of up to 28 per cent of the post establishment. A moratorium on filling staff vacancies had been effected in order to avoid overspending on the budget.
5.5.4 Correctional Services
Two prisons are currently being constructed through public-private partnerships. This effectively leverages capital funding which would otherwise have been unavailable, and ensures that infrastructure can be improved within resource constraints by spreading expenditure over a longer term. This has long term benefits of improved risk management, efficiency and effectiveness. The resultant decrease in prison over-crowding allows for better management of prisoners and better chances of promoting rehabilitation . Despite an increase in the number of awaiting trial prisoners and the overall prison population, the department has successfully reduced the number of escapees from prisons.
5.5.5 Water Affairs
The Department of Water Affairs has made good progress in terms of extending basic services to larger sections of the population. Table 5.5 captures the progress made since 1994, but also highlights the remaining challenges.
5.5.6 Welfare
The Department is transforming its approach from traditional welfare to developmental welfare,which focuses on facilitating opportunities for capacity development and self-help for those previously dependent on the state. Under this policy framework programmes such as the ”Flagship Programme for Unemployed Women with Children under Five“ have been conceived.
The Department also took the initiative in formulating the Non-profit Organisations Act to create an enabling environment wherein non-profit organisations can flourish and take up their role as full partners in future. service delivery endeavours. This Act also encourages transparency and accountability for these kinds of organisations that collect money from the public and that often receive substantial support from government and the donor community 5.5.7 Land Affairs and Agriculture
Since 1995 a total of 26 416 households have benefited from the transfer of close to 260 000 ha of land. A further 87 000 ha have already been approved for further redistribution. Obviously we recognise that if this is compared with the real land needs in the provinces, it is only a drop in the ocean. It is, however, a step in the right direction in a area where many countries have sought to make changes and have failed even after many years. The same can be said about the Land Restitution Programme. Since 1994, 784 land restitution cases have been resolved. These cases involved 14 899 claimant households, and a total of 89 518 beneficiaries. The total monetary value of restitution awards over this period was R78m. The downside is that a further 63 000 unverified land claims have not yet been resolved. This obviously represents a continuing challenge for the department.
5.5.8 Arts, Culture, Science and Technology
A significant shift in the policies of this department is contributing to a continuing change in societal conception of its identity and value system. The emphasis has moved away from ”Western“ art forms to a situation where multiple art forms, especially indigenous ones, are recognised and officially supported. This marks a reversal of the decimation of cultures and collective sense of identity by colonial invaders over centuries. To this effect, an effort is also made to establish infrastructure for arts and culture in communities previously ignored. Forty three new community arts centres have thus far been established with the majority of these to be found in Mpumalanga (seven), North West (seven), the Eastern Cape (six) and the Northern Cape (six). The s cope of heritage-related efforts has also been broadened. The histories and heroes of all population groups, rather than only Whites, are now honoured and their heritage equally conserved. The country has shifted from recognising two official languages to recognising 11 official languages and these are supported, inter alia, through translation services and capturing different languages in official correspondence, forms, and so on where requested.
The area of science and technology is also transformed by moving away from efforts that supports a ”siege mentality and economy“ to where the emphasis of science is on the contribution it can play in terms of development. For this purpose, the Innovation Fund has been set up, and the needs of communities are important criteria in deciding about resource allocation in the sciences. The department has completed a powerful ”Foresight“ exercise that firmly sets the scene for science and technology development o ver the medium term.
5.5.9 Housing
Significant improvements have been made in upgrading the housing stock since 1994. The comparisons of access to housing between 1996 and 1998 that are presented above in Table 5.6 capture this trend.
There is a sharp upward curve for the cumulative number of houses completed or under construction over the past five years as well as for subsidies issued during that time, with the number of subsidies now flattening out.
5.5.10 Communications
In 1997, Telkom installed 380 000 telephone lines. In any one year during apartheid, a maximum of 180 000 lines were installed. The Ministry provided 1,1 million new postal addresses in 1997. The Post Office handles eight million items daily. Over and above these achievements, progress has been made with regard to privatisation with massive spin-offs for universal telecommunication services.
5.5.11 Conclusion
In conclusion, these achievements are a result of many hours of intense dedication and commitment by public servants. Despite the frequent headlines that emphasise only the cases of ”doom and gloom“ we should always remember that the basic infrastructure of governance is operational every day. The things we take for granted, that make basic daily life and livelihoods possible need to be planned and managed by someone. The scale on which most of these things have to be provided mean there is enormous complexity to be managed through some public institution. This is not to make excuses for things that do not happen. Rather a plea that we recognise and acknowledge the things that do happen.
Of course, we all recognise the need to deal with the problems that still exist. We equally recognise that public servants who treat citizens like dirt, who do the least possible in a working day, who show callous regard for state property do exist. They show no sense of loyalty to the country and its people, and defraud the little resource pool from which we have to deliver services. Every one of them is one too many. Even one of them is a burden our development state can ill afford to bear. Even more, we recognise that there are managers and officials who let these things happen, by omission or commission. They too are as guilty as the people who defraud the state. They too are a burden to society’s progress.
Much effort over a relatively short period has gone into establishing appropriate systems, or improving existing systems, that can sustain the wider scope of service delivery. These systems can contribute to values of transparent and informed decision-making as well as improved accountability. Although this is relatively low-key work with little immediate visibility of success, investing in strong systems should pay off over the longer term.
Already we have seen that this approach has worked in the Department of Welfare where social grants and pensions are paid regularly to nearly three million beneficiaries. In its first year of operation, the newly established computer database of social welfare beneficiaries saved government about R96 million when 76 000 deceased beneficiaries were removed from the previous beneficiary list.
Other initiatives in improving systems include:
All these are contributing to the building of the infrastructure that make service delivery possible, on a scale that is required, with the quality that is expected.
One way of establishing whether or not we are making progress in terms of service delivery and transformation is to monitor the views of the population on how satisfied they are with government services. Much can be said about the efficacy of such tests in capturing the broad spectrum and diversity of views that exist in the broad populace. These surveys however represent one of the varieties of ways through which we can track the views of the population served by the public service on various issues.
There has been many examples of these surveys. For instance, the Human Science Research Council (HSRC) has been asking questions on what the public thinks to a randomly selected, representative sample of the South African population over a period of time. The survey of perceptions of citizens on the effectiveness of government over the period May 1994 to February 1998 shows a declining trend. In May 1994, 72 per cent of South Africans responded positively about the efficacy of government. By February 1998, the size of the population that thought government was effective has dropped to 43 per cent. The reverse trend was revealed in terms of those who thought government was ineffective. In May 1994, only six per cent of the population expressed an opinion that government was ineffective. By February 1998, this proportion of public opinion had swelled to 38 per cent.
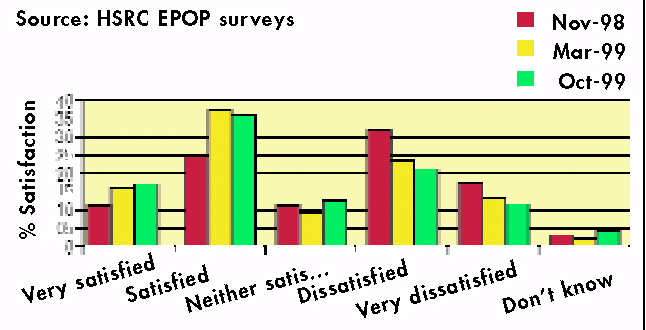
However, since November 1998, this survey is reflecting different trends in the opinions of the population. The majority of the population either feels satisfied or very satisfied with the way South Africa is currently being governed, and this proportion of opinion is growing. Overall, the proportion of dissatisfied citizens is shrinking systematically. This trend is graphically represented in Figure 5.1.
A more nuanced form of feedback from the citizens was received in the Markinor survey conducted in May 1999. On being asked how government was handling a range of issues, the following percentages of respondents thought that the issues were being handled ” very well“ or ”fairly well“. In terms of direct service delivery that pertains to the developmental agenda the government is rated moderately well.
Although the overall sentiment of the population regarding service delivery in some spheres may be changing in a positive direction, much room remains for improvement, both in terms of structure, processes and systems. Two studies undertaken by the DPSA of offers more contextualised and specific information about actual systems and processes that are deemed important for greater success in public service management and administration. The DPSA initiatives in the first instance are collecting information about key departments in sectors in order to build up a picture for the annual Sectoral Reviews. The first rounds of reports are summarised below, using a number of key, general themes.
Pull Quotes The comfortable world of government and public policy of the 1960’s and 1970’s has been transformed into a much more anxious and treacherous place (Peters, 1988:72)
”As the saying goes: ‘One falling tree makes more noise than millions that are growing’. As such, for both good and bad reasons, occasional problems are seized upon by our detractors as the stock-in-trade of this government, indeed as the essence of democracy’“ Former President Nelson Mandela
”For the first time ever, millions of people had the dignity of a proper address, with the expectation that they would be able to receive mail, just like normal people“. Jay Naidoo, Former Minister of Communications
Table 5.1 Distribution of services by population group of head of household, 1996
| African | Coloured | Asian | White | Unspecified/ Other | Total | |
| Energy source for lighting Electricity direct from authority Electricity: other sources Gas Paraffin Candles Unspecified / Other |
43% 0.3% 0.5% 17% 38% 0.9% |
83% 0.4% 0.3% 4.4% 11% 0.6% |
98.5% 0.1% 0.1% 0.3% 0.6% 0.5% |
98.5% 0.4% 0.1% 0.1% 0.2% 0.7% |
73.8% 0.3% 0.2% 5.5% 6.2% 4% |
57% 0.4% 0.4% 12.6% 128.5% 0.8% |
| Total in numbers | 6533998 | 741206 | 243639 | 1482492 | 58237 | 9059571 |
| Main water supply Piped water in dwelling Piped water on site or in yard Public tap Water-carrier/tanker Borehole/rain water tank/well Dam/river/stream/spring Unspecified/other |
26.7% 20.4% 26.3% 1.6% 5.9% 16.8% 2.2% |
71.9% 18.5% 4.9% 0.5% 1.9% 1.6% 0.7% |
97.2% 1.2% 0.38% 0.1% 0.6% 0.2% 0.4% |
95.9% 0.6% 0.1% 0% 2.6% 0.2% 0.4% |
66.3% 10.1% 8.7% 0.63% 2.7% 7.3% 4.3% |
43.9% 16.5% 19.5% 1.2% 4.9% 12.3% 1.7% |
| Total | 6533998 | 741206 | 243639 | 1482492 | 58237 | 9059571 |
| Toilet Facilities Flush or chemical toilet Pit latrine Bucket latrine None of the above Unspecified/other |
33.9% 43.5% 5.6% 16.4% 0.6% |
79.7% 7.8% 7.1% 5.1% 0.3% |
7.6% 1.8% 0.1% 0.2% 0.3% |
99.2% 0.3% 0.0% 0.1% 0.4% |
71.2% 14.9% 3.0% 7.1% 3.8% |
50.3% 32.3% 4.6% 12.3% 0.5% |
| Total | 6533998 | 741206 | 243639 | 1482492 | 58237 | 9059571 |
| Refuse removal Removed by local authorities at least once a week Removed by local authorities less often Communal refuse dump Own refuse dump No rubbish disposal Unspecified/other |
37.2% 2.8% 3.7% 41.6% 12.8% 1.9% |
80.3% 1.2% 4.2% 10.8% 1.7% 1.7% |
95.8% 0.4% 0.3% 2.2% 0.5% 0.8% |
90.4% 0.5% 0.9% 6.2% 0.5% 1.6% |
70.5% 1.3% 2.0% 15.2% 5.5% 5.4% |
51.2% 2.2% 3.2% 32.1% 9.5% 1.8% |
| Total | 6533998 | 741206 | 243639 | 1482492 | 58237 | 9059571 |
Source: Stats in brief 2000
Table 5.2 Type of dwelling by population group of head of household
| African | Coloured | Asian | White | Unspecified/ Other | Total | |
| House or brick structure on a separate stand or yard | 40.9% | 61.0% | 57.7% | 69.8% | 53.5% | 47.8% |
| Traditional dwelling/hut/ structure made of traditional materials | 24.7% | 1.9% | 0.5% | 0.7% | 10.2% | 18.2% |
| Flat in a block of flats | 2.3% | 7.8% | 14.1% | 14.0% | 8.0% | 5.1% |
| Town/cluster/semi-detached house (simplex, duplex or triplex) | 1.5% | 13.3% | 19.1% | 9.1% | 7.8% | 4.2% |
| Unit in retirement village | 0.1% | 0.1% | 0.1% | 2.1% | 0.3% | 0.4% |
| House/flat/room, in backyard | 6.1% | 5.1% | 5.6% | 1.9% | 4.7% | 5.3% |
| Informal dwelling/shack, in backyard | 5.7% | 3.6% | 0.3% | 0.1% | 2.9% | 4.5% |
| Informal dwelling/shack NOT in backyard e.g. in an informal/squatter settlement | 15.5% | 4.2% | 0.4% | 0.1% | 5.6% | 11.6% |
| Room/flat not in backyard but on a shared property | 1.6% | 1.6% | 1.3% | 1.0% | 2.6% | 1.5% |
| Caravan/tent | 0.2% | 0.4% | 0.0% | 0.2% | 0.3% | 0.2% |
| None/homeless | 0.0% | 0.0% | 0.0% | 0.0% | 0.0% | 0.0% |
| Unspecified | 1.3% | 1.0% | 0.7% | 1.0% | 4.2% | 1.2% |
| Total | 6533998 | 741206 | 243639 | 1482492 | 58237 | 9059571 |
Source: The people of South Africa - Population Census, 1996
Table 5.3 ”What are the most important problems facing this country that government ought to address?“
| Sept-Oct 1994 | Sept-Nov 1995 | June-July 1997 | September 1998 | Oct-Nov 1998 | Feb-March 1999 | April 1999 | |
| Job Creation | 67% | 74% | 68% | 73% | 75% | 75% | 79% |
| Crime and Security | 6% | 32% | 58% | 64% | 61% | 62% | 65% |
| Housing | 46% | 54% | 44% | 22% | 34% | 32% | 32% |
| Education | 34% | 20% | 20% | 24% | 23% | 28% | 26% |
| Health Care | 2% | 7% | 10% | 13% | 11% | 14% | 12% |
| Water | 0% | 5% | 4% | 6% | 13% | 13% | 11% |
| Corruption | 0% | 2% | 6% | 6% | 7% | 8% | 10% |
| General Economy | 21% | 10% | 8% | 18% | 16% | 12% | 10% |
| Electricity | – | 2% | 4% | 4% | 11% | 8% | 7% |
| Poverty | 9% | 6% | 3% | 9% | 12% | 7% | 9% |
| Violence | 49% | 32% | 8% | 8% | 5% | 4% | 4% |
| Discrimination | 19% | 4% | 2% | 2% | 4% | 4% | 3% |
| Immigration | – | 3% | 1% | 4% | 2% | 1% | 2% |
| Political Violence | 7% | 6% | 1% | 0% | 1% | 1% | 1% |
Source: Opinion ‘99 Survey
Table 5.4 Services delivered by the Department of Home Affairs 1994–1999
QUANTITY OF OUTPUTS |
|||||
| Services | 1994/95 | 1995/96 | 1996/97 | 1997/98 | 1998/99 |
| ID Documents issued | 4 636 995 | 2 830 940 | 2 222 441 | 2 498 970 | 3 127 965 |
| Passports and travel documents issued | 31 523 | 53 994 | 459 135 | 889 340 | 1 035 116 |
| Certificates issued (birth, marriage, deaths and driver’s licenses) | 1 116 063 | 1 914 915 | 2 193 734 | 2 992 097 | 3 650 404 |
| Persons cleared by immigration officers | 19 760 394 | 24 534 765 | 26 951 219 | 26 877 074 | 29 200 642 |
| Repatriation | 90 692 | 157 084 | 180 713 | 176 351 | 181 286 |
Source: Public Service Commission, Batho Pele Survey in Department of Home Affairs, 2000
Table 5.5 Access to basic water supply since 1994
| 1994 | 1999 | |
| RURAL | Only 6 out of 18 million people had access | Now 10.4 million out of 20.2 million people have access |
| 33% | 51% | |
| URBAN | 17.6 out of 20.8 million people had access | Now 21.6 out of 23.3 million people have access |
| 84% | 92% | |
| NATIONAL | 23.6 out of 38.8 million people had access | Now 32 out of 43.5 million people have access |
| 61% | 73% |
Source: Stats SA presentation to Cabinet, 2000
Table 5.6 Access to housing, 1996 – 1998
| Type of housing | % Urban dwellers | % Non-urban dwellers | Total population | |||
| 1996 | 1998 | 1996 | 1998 | 1996 | 1998 | |
| Back room | 4.7 | 3.8 | 2.6 | 5.2 | 3.8 | 4.4 |
| Informal | 16.8 | 15.2 | 4.9 | 5.2 | 12.0 | 11.2 |
| Traditional | 2.5 | 2.3 | 43.9 | 29.3 | 19.1 | 13.2 |
| Formal | 76.1 | 78.6 | 48.5 | 60.0 | 65.1 | 71.1 |
Source: Stats SA presentation to Cabinet, 2000
Table 5.7 Positive ratings of Government performance
| Policy issue | % |
| Promoting equality between men and women | 79 |
| Uniting all South Africans into one nation | 72 |
| Delivering basic services, i.e. water, electricity | 72 |
| Improving basic health services | 66 |
| Encouraging international investment | 66 |
| Addressing educational needs of all South Africans | 64 |
| Ending political violence | 62 |
| Building houses | 61 |
| Bringing the police closer to the community | 60 |
| Narrowing the income gap between races | 59 |
| Maintaining transparency and accountability | 55 |
| Appointing the right people to lead government | 49 |
| Managing the economy | 47 |
| Fighting corruption in government | 44 |
| Controlling inflation | 42 |
| Reducing the crime rate | 26 |
| Reducing unemployment | 24 |
Source: Markinor, 1999
Table 5.8 Summary findings of three review reports
| THEME | HOUSING | TRANSPORT AND PUBLIC WORKS | HEALTH |
| Strategic planning |
|
|
|
| Recruitment |
|
|
|
| Personnel numbers |
|
|
|
| Review conditions of service |
|
|
|
| Supernumeraries |
|
|
|
| Reduction of personnel expenditure |
|
|
|
| Employment Equity |
|
|
|
| More efficient workforce |
|
|
|
| Performance management system for individuals |
|
|
|
| Financial Management |
|
|
|
| Financial independence |
|
|
|
| State Assets |
|
|
|
| ASD options |
|
|
|
| Core and non-core functions |
|
|
|
| Inter-provincial relations |
|
|
|
| Inter-governmental Relations |
|
|
|
| Monitoring and management of quality |
|
|
|
| Co-ordination role |
|
|
|
| IT Systems |
|
|
|
| Major External Challenges |
|
|
|
The second DPSA initiative, the Integrated Implementation Programme, which was primarily undertaken to assist specific provinces with meeting the requirements in terms of the new Public Management Framework, resulted in quite rich information about the situation in these provinces. The findings of the various provincial reports are summarised in Table 5.9.
Table 5.9 Summary findings of the IIP process in selected provinces
| THEME | EASTERN CAPE | KWAZULU-NATAL | NORTHERN PROVINCE |
| Strategic planning |
|
|
|
| Backlog of personnel entitlements |
|
|
|
| Recruitment |
|
|
|
| PERSAL |
|
|
|
| Reduction of personnel expenditure |
|
|
|
| Supernumeraries |
|
|
|
| Notch increases |
|
|
|
| Performance Management Systems for Individuals |
|
|
|
| More efficient workforce/adjusting to challenges |
|
|
|
| Financial management |
|
|
|
| Budgets/provisions |
|
|
|
| State Assets |
|
|
|
| Financial independence |
|
|
|
| ASD options |
|
|
|