FISCAL POLICY AND THE BUDGET FRAMEWORK
The fiscal policy framework
Government’s fiscal policy seeks to support structural reforms of the South African economy consistent with long run growth, employment creation and an equitable distribution of income. It aims to promote investment and export expansion while enabling Government to finance public services, redistribution and development in an affordable and sustainable budget framework.
Fiscal policy aims
Fiscal policy seeks to:
- ensure a sound and sustainable balance between Government’s spending, tax and borrowing requirements;
- improve domestic savings to support a higher level of investment and reduce the need to borrow abroad;
- keep government consumption spending at an affordable level, contributing to lower inflation and a sustainable balance of payments;
- support an export-friendly trade and industrial strategy to improve South Africa’s competitiveness; and
- ensure that pay increases within the public sector are market and productivity related, and are fiscally sustainable.
Medium term fiscal objectives
Within the current medium term planning horizon, Government aims to:
- reduce the level of borrowing used to finance current spending;
- reduce the overall tax burden as a share of GDP over time; and
- reduce government consumption spending as a share of national income.
Commitment to sound public finances
Government remains committed to a sound and stable fiscal policy, aimed at ensuring the sustainability of South Africa’s economic transformation, promoting jobs and investment, and ensuring that public services reflect Government’s priorities.
The Government’s commitment to sound public finances and a sustainable deficit has protected South Africa from the worst of the current international financial crisis, and has contributed to the structural changes needed to strengthen the long run performance of the economy.
Government revenue, expenditure and borrowing
Recent trends in the broader public finances, including the national and provincial authorities, extra-budgetary accounts and funds, social security funds and local government, are summarised below.
Consolidated general government revenue
Tax revenue, including social security contributions and local rates and taxes, has risen steadily from 25,6 per cent of GDP in 1992/93 to an estimated 28,5 per cent in 1997/98. Non-tax revenue of the general government has remained at about 4,0 per cent of GDP over this period.
Current non-interest expenditure
Consumption expenditure by general government grew strongly in real terms in 1997/98, amounting to an estimated 21,7 per cent of GDP, compared to 20,6 per cent recorded in the previous fiscal year. Personnel remuneration accounts for 58,8 per cent of government consumption expenditure. Transfers and subsidies amounted to about 5,1 per cent of GDP in 1997/98, mainly comprising social grants and unemployment benefits.
Interest on public debt
Interest on debt absorbed 6,7 per cent of GDP in 1997/98, compared to about 3,6 per cent five years ago.
Dissaving
Government dissaving (that is, current expenditure on interest, consumption, subsidies and transfers in excess of revenue) has fallen significantly from a peak of 6,4 per cent of GDP in 1993. After adjustments for depreciation and inventory valuation, Government dissaving in 1997 amounted to 3,7 per cent of GDP.
Investment
Capital expenditure by the general government increased by 12,4 per cent in 1997/98, reflecting a real growth rate of 5 per cent. This reflects a significant improvement in the contribution of government to infrastructure investment.
Public sector borrowing requirement
Taking into account the overall general government accounts, and the surpluses or deficits of public enterprises, the public sector borrowing requirement has been reduced from 10,4 per cent of GDP in 1993/94, to 5,2 per cent in 1997/98. In nominal terms, the public sector borrowing requirement declined by 7 per cent in 1997/98 to an estimated R31,3 billion.
Government’s medium term fiscal strategy envisages further steady reductions in the borrowing requirement over the next three years, in line with the projected reduction in the national budget deficit.
Revised fiscal projections
Lower growth reduces available resources
International developments and the extended slowdown in the South African economy this year have led to downward adjustments in expected growth for the next three years. Lower growth reduces government revenue and constrains the resources available to the fiscus and the broader economy.
Adjustments to baseline projections
Within the context of the fiscal policy framework outlined above, Government has made the following revisions to the baseline medium term fiscal projections set out in the March 1998 Budget:
- a budget deficit for 1998/99 of 3,9 per cent of GDP is now expected (compared to a March estimate of 3,5 per cent);
- debt interest costs will be R1,2 billion more in 1998/99 than originally budgeted and a projected R3,0 billion more in subsequent years;
- revenue of 27,1 per cent of GDP is expected in 1998/99, falling to 26,5 per cent in 2001/02 – about 0,7 per cent of GDP higher each year than in the baseline projections; and
- a budget deficit of 3,5 per cent of GDP is projected in 1999/00 (compared to a baseline 3,0 per cent), falling to 3,0 per cent in subsequent years.
These adjustments to the baseline medium term budget framework are summarised below and discussed in more detail in the paragraphs that follow.
Table 3.1: Baseline and revised medium term budget framework
1998/99 |
1999/00 |
2000/01 |
2001/02 |
||||
| R billion | Baseline |
Revised |
Baseline |
Revised |
Baseline |
Revised |
|
| Revenue | 177,6 |
178,0 |
193,4 |
191,3 |
210,5 |
206,2 |
220,1 |
| as per cent of GDP | 26,5% |
27,1% |
26,3% |
26,9% |
26,0% |
26,8% |
26,5% |
| Expenditure | 201,3 |
203,9 |
215,7 |
216,5 |
235,0 |
229,6 |
245,0 |
| Interest on debt | 42,5 |
43,7 |
45,0 |
48,0 |
48,0 |
51,0 |
54,0 |
| Non-interest spending | 158,8 |
160,2 |
170,7 |
168,5 |
187,0 |
178,6 |
191,0 |
| Deficit | 23,7 |
25,9 |
22,3 |
25,2 |
24,5 |
23,4 |
24,9 |
| as per cent of GDP | 3,5% |
3,9% |
3,0% |
3,5% |
3,0% |
3,0% |
3,0% |
| GDP | 669,0 |
656,9 |
734,3 |
710,2 |
809,6 |
768,1 |
830,8 |
Note: Repayments and recoveries of loans and advances are included in revenue in these estimates.
Robust tax performance
Total national budget revenue amounted to 27,2 per cent of GDP in 1997/98. Despite the slower economic growth recorded in the first half of 1998/99, revenue collection remains buoyant. Combined Customs and Excise and Inland Revenue collections increased by 9,3 per cent up to September 1998, compared to the same period of 1997/98.
Revised revenue projections
Revenue in 1998/99 is expected to exceed the budget target slightly, and will amount to 27,1 per cent of the revised GDP estimate. The revised budget framework allows for a phased reduction in the national revenue aggregate to 26,5 per cent of GDP in 2001/02.
Higher debt service cost
Higher interest rates than anticipated this year have sharply increased debt service costs, highlighting the importance of Government’s commitment to reducing the annual borrowing requirement. The reduction in the budget deficit as a share of GDP since 1994 has already released about R4 billion in interest costs that would otherwise have had to be found in the 1998/99 budget.
The higher debt service costs reflected in the revised budget framework are mainly the consequence of adverse financial market conditions this year. Higher capital market rates have significantly raised the costs of financing this year’s deficit and refinancing maturing government stock. In addition, the revised framework projects higher deficits in 1998/99 and 1999/00, in turn leading to increased interest costs in subsequent years.
Adjusted deficit targets
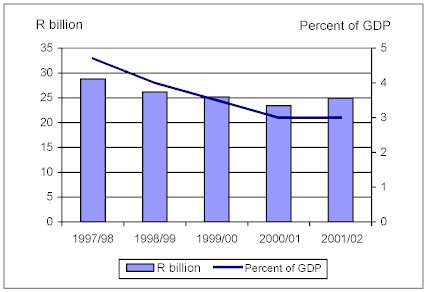
Revised budget deficit projections of 3,9 per cent in 1998/99 and 3,5 per cent in 1999/00 reflect the impact on the fiscus of lower GDP growth and unusually high interest costs, together with a consideration of social and developmental spending priorities.
Adverse economic conditions have necessitated substantial downward adjustments in non-interest spending over the 1999/00-2001/02 period. In addition, the revenue and deficit targets have been reviewed. In adjusting the budget framework consideration has been given to the overall balance of spending, revenue and borrowing in a context of an unanticipated slowdown in the economy. Government has been mindful also of the need for stability in funding basic services and for a realistic phasing in of fiscal adjustments. While retaining Government’s commitment to a sustainable fiscal policy, the deficit reduction target has accordingly been postponed by a year. The budget deficit is still expected to reach 3,0 per cent of GDP in 2000/01 and beyond.
Figure 3.1: Budget deficit – 1997/98-2001/02
Spending objectives
Within the projected spending totals, Government is committed to reprioritising spending to meet reconstruction and development objectives, with additional emphasis in the revised medium term expenditure framework on job creation, infrastructure investment, strengthening the integrated justice system and the consolidation of education, health and welfare services. Chapter 4 provides more details.
Changes to the medium term budget framework
1998/99 adjustments
The Adjustments Estimate reflects the following additions to the 1998/99 expenditure estimates:
At this stage additional revenue of R384 million is anticipated, including a R350 million receipt to the Exchequer following the closing of the Post Office Fund.
After taking into account the contingency reserve of R1,0 billion set aside in the 1998/99 Budget, the overall impact is an increase of R2,2 billion in the projected deficit to R25,9 billion, or 3,9 per cent of revised GDP.
Donor funding expenditure
The Adjustments Estimates also shows R651 million of additional spending financed from foreign grants or international cooperation agreements. International budgetary support is expected to continue to grow over coming years, in keeping with various sectoral agreements with partner countries. This spending and revenue is excluded from the budget framework set out in this Statement.
Revenue estimates
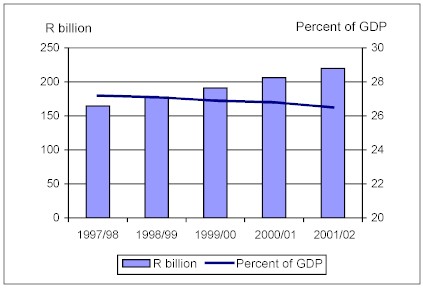
National budget revenue is expected to grow by an annual average rate of 7,3 per cent over the next three years. In real terms, this amounts to an annual average growth rate of 2,3 per cent over the MTEF period.
Table 3.2: Growth of budget revenue
| 1997/98 | 1998/99 | 1999/00 | 2000/01 | 2001/02 | ||
| R billion | Outcome | Budget | Revised | Medium term estimates |
||
| Revenue | 165,3 |
177,6 |
178,0 |
191,3 |
206,2 |
220,1 |
| as per cent of GDP | 27,2% |
26,5% |
27,1% |
26,9% |
26,8% |
26,5% |
| nominal growth | 7,4% |
7,7% |
7,5% |
7,8% |
6,7% |
|
| real growth | 1,4% |
-0,3% |
1,5% |
2,8% |
2,7% |
|
| Change from baseline | 0,4 | -2,1 | -4,3 | |||
Table 3.2 shows the envisaged decline in revenue as a share of GDP from 27,2 per cent to 26,5 per cent in 2001/02. The table also indicates the changes in budget revenue relative to baseline projections.
Figure 3.2: Budget revenue – 1997/98-2001/02
Budget expenditure
Budget expenditure is expected to grow by an annual average rate of 6,3 per cent over the next three years. In real terms, this amounts to an average annual growth rate of 1,3 per cent over the MTEF period. Table 3.3 shows the changes in expenditure estimates relative to the March 1998 baseline projections.
Figure 3.3: Budget expenditure – 1997/98-2001/02
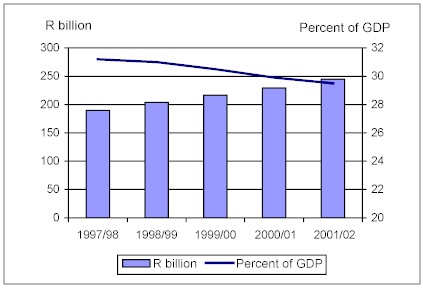
Table 3.3: Growth of budget expenditure
1997/98 |
1998/99 |
1999/00 |
2000/01 |
2001/02 |
||
| R billion | Outcome |
Budget |
Revised |
Medium term estimates |
||
| Expenditure | 190,2 |
201,3 |
203,9 |
216,5 |
229,6 |
245,0 |
| as per cent of GDP | 31,3% |
30,1% |
31,0% |
30,5% |
29,9% |
29,5% |
| nominal growth | 5,8% |
7,2% |
6,2% |
6,1% |
6,7% |
|
| real growth | -0,2% |
-0,8% |
0,2% |
1,1% |
2,7% |
|
| Change from baseline | 2,6 |
0,8 |
-5,4 |
|||
The available expenditure level
The expenditure level in the MTEF refers to the total nationally-financed spending to be shared between the national, provincial and local spheres of government, as described in more detail in chapter 5 of this Statement.
Amounts set aside
Before expenditure is equitably divided among the three spheres of government, two items are set aside from the total. These are:
Debt service costs
Provision is made for debt service costs on the following assumptions:
Interest as % of GDP
It is projected that interest on debt will be reduced from 6,8 per cent of GDP in 1999/00 to 6,5 per cent by 2001/02.
The impact of higher interest rates on debt service cost projections is illustrated in table 3.4.
Table 3.4: Debt service costs
1997/98 |
1998/99 |
1999/00 |
2000/01 |
2001/02 |
||
| R billion | Outcome |
Budget |
Revised |
Medium term estimates |
||
| Debt service costs | 39,4 |
42,5 |
43,7 |
48,0 |
51,0 |
54,0 |
| as per cent of expenditure | 20,7% | 21,1% | 21,4% | 22,2% | 22,2% | 22,0% |
| as per cent of GDP | 6,5% | 6,4% | 6,7% | 6,8% | 6,6% | 6,5% |
| average bond rate assumed | 13% | 16% | 14% | 13% | 12% | |
| Change from baseline | 1,2 | 3,0 | 3,0 | |||
The contingency reserve
The contingency reserve is set aside within the expenditure total to deal with unforeseen circumstances. This ensures that Government can adjust to adverse macroeconomic developments, or make funds available for natural or other disasters, without breaking the overall expenditure ceiling.
Table 3.5: The contingency reserve
1998/99 |
1999/00 |
2000/01 |
2001/02 |
|||
| R billion | Budget |
Revised |
Medium term estimates |
|||
| Contingency reserve | 1,0 |
- |
1,5 |
3,0 |
7,0 |
|
| as per cent of expenditure | 0,5% |
- |
0,7% |
1,3% |
2,9% |
|
| Change from baseline | -1,0 |
-1,5 |
-4,0 |
|||
Provision for macroeconomic uncertainty
The revised macroeconomic projections and higher interest costs are the first claims against the contingency reserve. The contingency reserve has consequently served a useful purpose in the current medium term budget framework in providing a cushion to reduce the impact of lower-than-expected GDP growth.
Changes in priorities
A component of the contingency reserve, in the second and third years of the projections, will be allocated as part of the 2000/01 and 2001/02 budget processes. This part of the reserve may be used to address emerging policy priorities or changes in economic circumstances. This enables Government to address its priorities in future budgets without having to disrupt the expenditure plans of other services.
Total available spending
Growth in available expenditure
Total budget expenditure, less debt interest and the contingency reserve, is expected to grow by an annual average rate of 4,6 per cent over the next three years, which is broadly unchanged in real terms. The growth in total available spending accelerates through the latter two years of the MTEF period.
Recovery from pension funds
As set out in the 1998 Budget Review, Government proposes to lower the employer’s contribution to pension funds from 17 per cent to 15 per cent this year, in keeping with actuarial advice. This has yet to be finalised in negotiations with employee representatives. At this stage, for comparability and consistency, the budget is prepared inclusive of a 17 per cent employer’s contribution and a recovery from pension funds corresponding to the reduction in the contribution rate is shown as a deduction from the spending aggregate.
Division of resources
Table 3.5 summarises the total expenditure available over the MTEF period. While the 1998/99 Adjustments Budget provides for an additional R2,5 billion in non-interest allocations, the available expenditure level is reduced by R0,7 billion in 1999/00 and by R4,4 billion in 2000/01. The division of the available expenditure between the national, provincial and local shares is explained in chapter 5 of this Statement.
Table 3.6: Growth in total available spending
1997/98 |
1998/99 |
1999/00 |
2000/01 |
2001/02 |
||
| R billion | Outcome |
Budget |
Revised |
Medium term estimates |
||
| National budget expenditure | 190,2 |
201,3 |
203,9 |
216,5 |
229,6 |
245,0 |
| Less amounts set aside | ||||||
| Debt service costs | 39,4 |
42,5 |
43,7 |
48,0 |
51,0 |
54,0 |
| Reserve | - |
1,0 |
- |
1,5 |
3,0 |
7,0 |
| Recovery from pension funds | - |
0,9 |
0,9 |
0,9 |
1,0 |
1,0 |
| Total expenditure to be shared | 150,9 |
158,6 |
161,1 |
167,9 |
176,6 |
185,0 |
| Change from baseline | 2,4 |
-0,7 |
-4,4 |
|||
Consolidated revenue and expenditure
Table 3.7 shows the projected consolidated national and provincial revenue, expenditure and deficit levels, taking into account provincial own revenue and overall spending projections.
Table 3.7: Consolidated revenue and expenditure
1997/98 |
1998/99 |
1999/00 |
2000/01 |
2001/02 |
||
| R billion | Outcome |
Budget |
Revised |
Medium term estimates |
||
| National budget revenue | 165,3 |
177,6 |
178,0 |
191,3 |
206,2 |
220,1 |
| Provincial own revenue | 3,4 |
3,9 |
3,3 |
3,8 |
4,1 |
4,4 |
| Consolidated revenue | 168,7 |
181,5 |
181,3 |
195,1 |
210,3 |
224,5 |
| National budget expenditure | 190,2 |
201,3 |
203,9 |
216,5 |
229,6 |
245,0 |
| Provincial self-funded expenditure | 9,3 |
3,9 |
3,3 |
3,8 |
4,1 |
4,4 |
| Consolidated expenditure | 199,5 |
205,2 |
207,2 |
220,3 |
233,7 |
249,4 |
| National budget deficit | 24,9 |
23,7 |
25,9 |
25,2 |
23,4 |
24,9 |
| Consolidated deficit | 30,8 |
23,7 |
25,9 |
25,2 |
23,4 |
24,9 |
| as per cent of GDP | 5,1% |
3,5% |
3,9% |
3,5% |
3,0% |
3,0% |
Conclusion
Government remains committed to sound and sustainable fiscal policies. Budget projections have been revised to reflect changed economic circumstances and to ensure realistic and deliverable spending totals. Within a framework in which the budget deficit is reduced to 3,0 per cent of GDP and revenue falls moderately as a share of GDP, overall expenditure is projected to increase by an annual average of 6,3 per cent over the next three years. The expenditure level includes provision for debt service costs, a rising contingency reserve and a stable level of real expenditure available to be allocated to the three spheres of Government over the MTEF period.
| Contents | Next |